The Return(s) of the Wildfire Smoke + How To Read AQHI/AQI Charts
A recurring theme this summer that I update as needed.
August 2nd/3rd, 2023
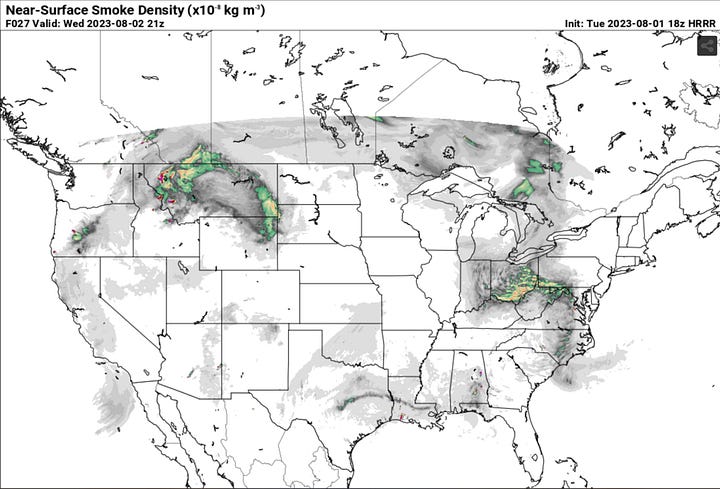
A plume of smoke aloft will return to Southern Ontario and parts of the US northeast starting tomorrow (August 2nd). The picture above shows the current smoke situation; the visible haze across Lakes Superior, Michigan & parts of Erie down through the NE US is apparent.
The synoptic setups that bring wildfire smoke to this area (assuming wildfires are ongoing, which they should be for the foreseeable future across Canada) are consistent. When hot, dry and windy conditions are prevalent, like they have been out west, the fires strengthen and the smoke is blown elsewhere down range. As you’d expect, the direction the wind is blowing determines who gets impacted.
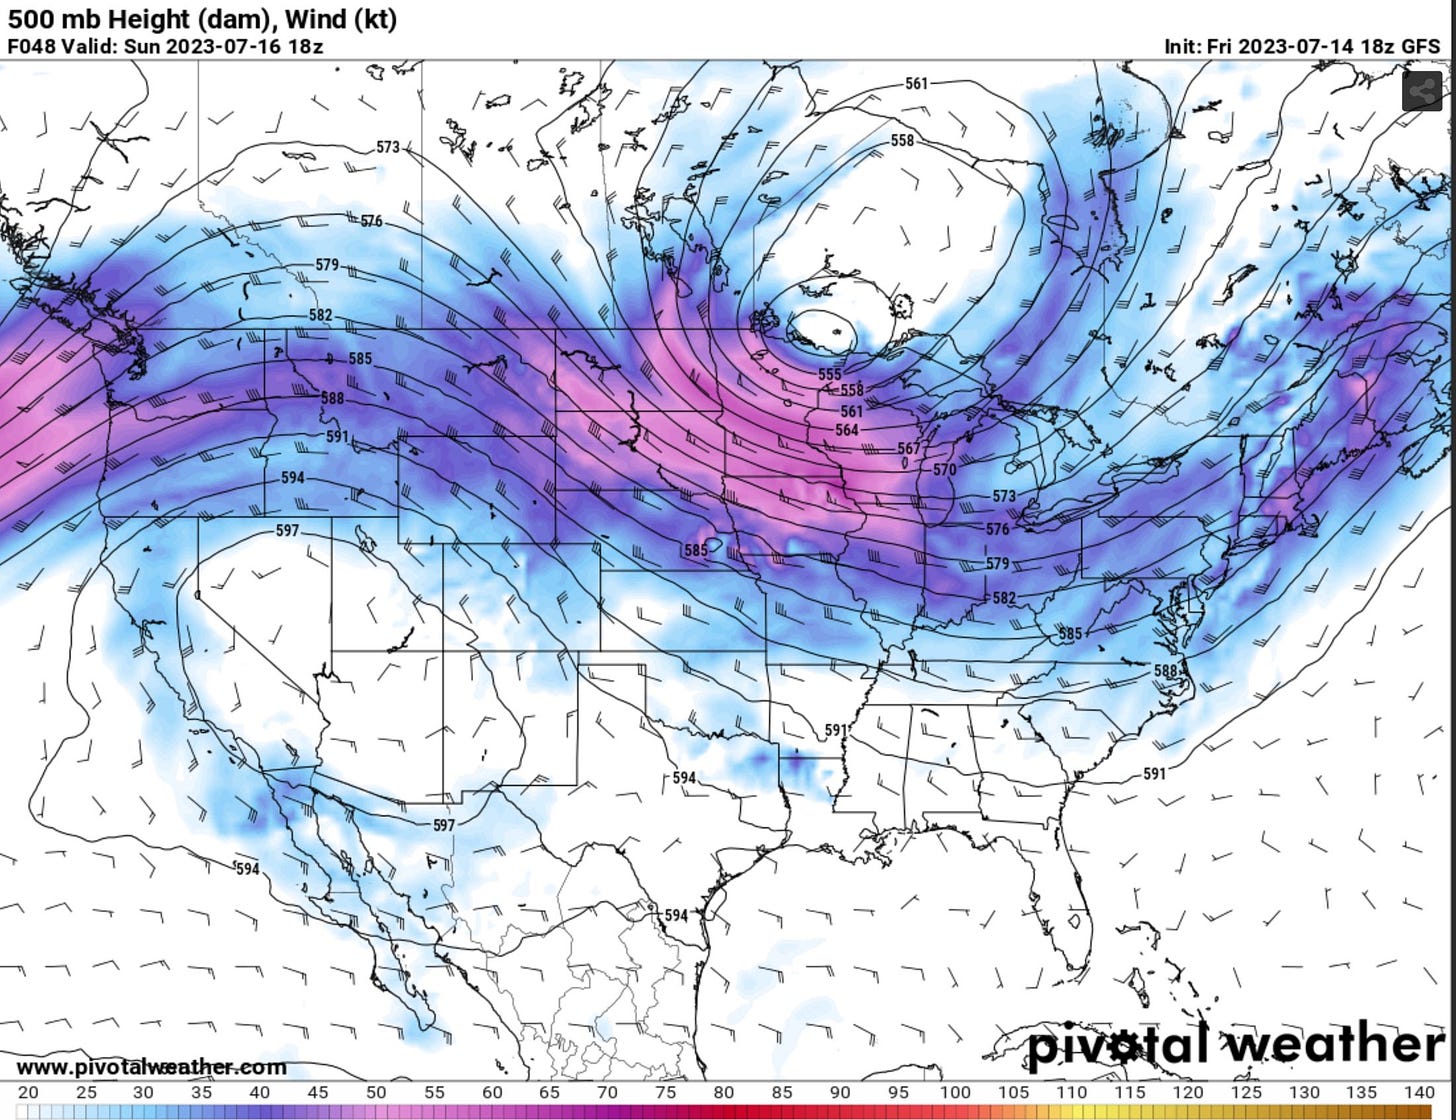
The near zonal (west to east) flow of the 500 mb winds (similar to past setups, above) carries the smoke from the wildfires in western Canada in the NW flow to Ontario. If you compare the 500 mb wind direction in the image directly above with the visible satellite image, you’ll see that the winds and smoke are oriented similarly (though keeping in mind the model image above is a prediction for tomorrow afternoon). This is not too dissimilar to the event in mid-July here, but very different from the June event (which was northerly flow and smoke from a different source: the Quebec fires).
With this expected flow to remain in place for several days ahead, it would not be surprising to see a haze in the sky and perhaps some level of deteriorating air quality over the coming few days. How badly will this affect air quality?


In the left image, a product called “Near Surface Smoke Density” is shown. It does not project a terrible air quality day like we’ve seen in the past, but does project at least some minor mixing down of the smoke from aloft. The right image is of a sounding near Kitchener showing a well mixed boundary layer in the afternoon. This is relevant because well mixed soundings allow for winds, and potentially anything they are carrying, to be brought down to the surface.
In short, thankfully, it does not look like it will be a horrid air quality day like we had back in June, but, having said that, the degree of which can vary (the Near Surface product can be hit or miss) because smoke affecting air quality relies on both the degree of mixing and the available concentration of the smoke aloft.
At the very least, don’t be surprised to see haze in the sky and maybe some creepy sun pictures that we’ve all gotten familiar with this summer.
The Week of July 14-18th+, 2023
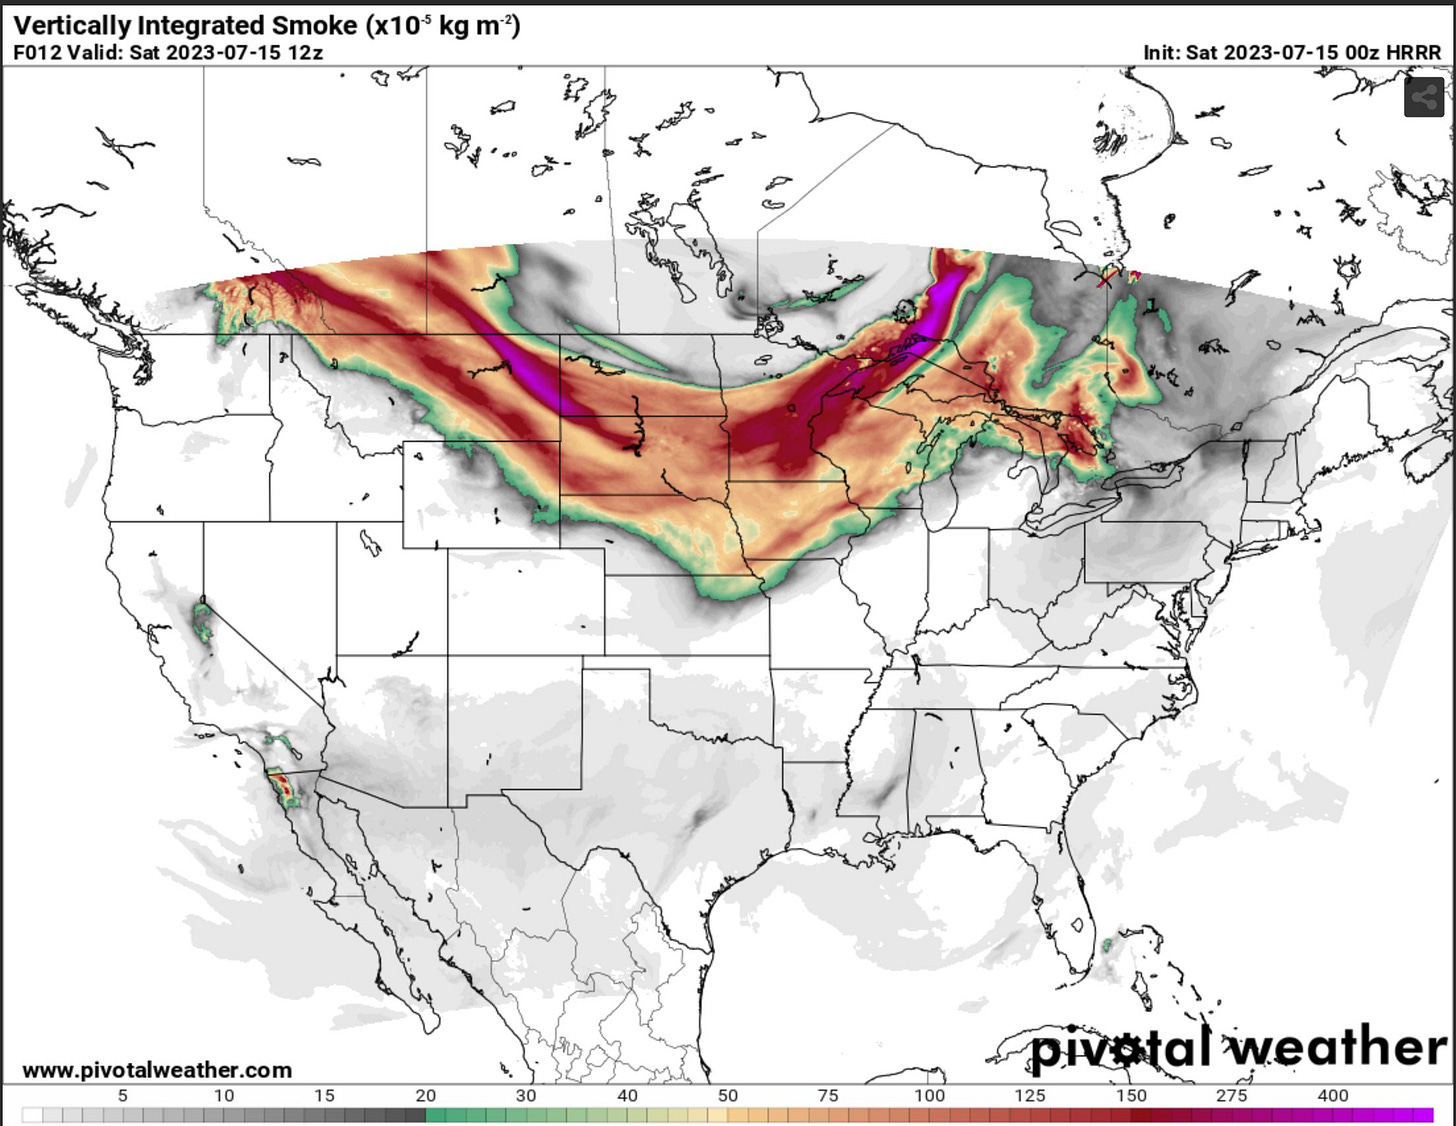
Wildfires across the Canadian west (Alberta & BC) have flared back up as above normal temperatures and mostly dry conditions have prevailed across the area. Ridging (high pressure, picture above) in place will ensure that this warm and dry pattern will continue; allowing fires to continue unabated. As a result, wildfire smoke will be transported across parts of North America over the next few days.
Looking at the image above (forecasted for the morning of Saturday, July 15th, 2023), a large section of the US midwest, and eventually the US and Canadian northeast, will have some degree of wildfire smoke in the vicinity. Wildfire smoke reaching the surface is difficult to predict due to a variety of factors (vertical mixing, density of smoke aloft), so I like using a product called “Vertically Integrated Smoke”. This product estimates the amount of smoke across a vertical section of the atmosphere. If you stand in one spot and look directly up, this product estimates how much smoke you’ll see in that spot directly above you. Even if the amount of smoke reaching the surface is smaller than anticipated, the smoke aloft can still block the sun and influence daytime temperatures. This product helps illustrate those concerns.
To predict the flow of where the smoke goes, you’d want to look at the upper and mid level wind patterns. In the image below, the 500 mb winds pass over the wildfire areas (western Canada) and shuttle that smoke south and eastward; influenced by the upper level low located to the west of Lake Superior.
With this zonal (west to east) pattern projected to stay in place for several more days, the image below shows you the influence of the mid level low. Smoke is projected to reach the Great Lakes and the Appalachians by Sunday morning and continue east. You can also see the origin point in the mid level flow. Until that pattern breaks, you can expect the smoke to be a part of the midwest and northeast for the next several days. The extent of which reaches the surface and affects air quality? That is a bigger question that’ll be answered quickly if you’re in affected regions once you step outside the house.
June 27th, 2023 Event
As I write this at 6pm EST, some of Southern Ontario is already under the influence of worsening air quality from the wildfire smoke originating in Quebec and Northern Ontario (yes, from those same fires from about a month ago). The slow moving surface low that has been responsible for severe weather in southwest Ontario on Sunday and a barrage of thundershowers all across the rest of Ontario Monday and Tuesday. Before the low finally moves out of the region, it’ll have one last influence on Ontario and the US Northeast over the next few days: wildfire smoke advection.
Synoptic Setup
The wildfire smoke will return (if it hasn’t already) because of a lingering low pressure system that, based on how it is structured, is sending the smoke into the US midwest and parts of the northeast as we speak, and further south and east into Wednesday and Thursday. The wrap-around winds are the reason why this area is being impacted currently. Chicago, Illinois has among the worst air quality in the world as of this writing.
In the image below, I’ve made a quick diagram that shows wind direction, cloud cover and the wildfire smoke (the brownish haze just to the east of Lake Michigan). As the low continues to slowly move off to the east, the wrap-around winds, and therefore the smoke being carried by it, will be sent south and east of the Quebec fire origin site for both Wednesday and likely Thursday.
As a result, for much of Southern Ontario and the northeast US, you can expect air quality to drop significantly, beginning later tonight and throughout tomorrow (Wednesday, June 28th, 2023).
Air Quality Charts and How To Read Them: The AQHI
To gauge how bad the air quality will get, there are two metrics of air quality measurement: the AQI & the AQHI. “The Air Quality Index (AQI) communicates the air quality of the single worst pollutant. The index rating for the new Air Quality Health Index (AQHI) is the sum of the health risks from each of the pollutants in the index”. In effect, the AQHI takes into account all large quantity pollutants as opposed to the highest concentration pollutant only in the AQI.
The Government of Canada uses the AQHI as their standard. As an example of how to read these charts, I’ll use the city of Barrie. Tonight and throughout tomorrow, Barrie is expected to see between a 7-9 High Risk, so being outdoors in this timeframe will mean exposure to bad air quality & pollutants.
The AQI
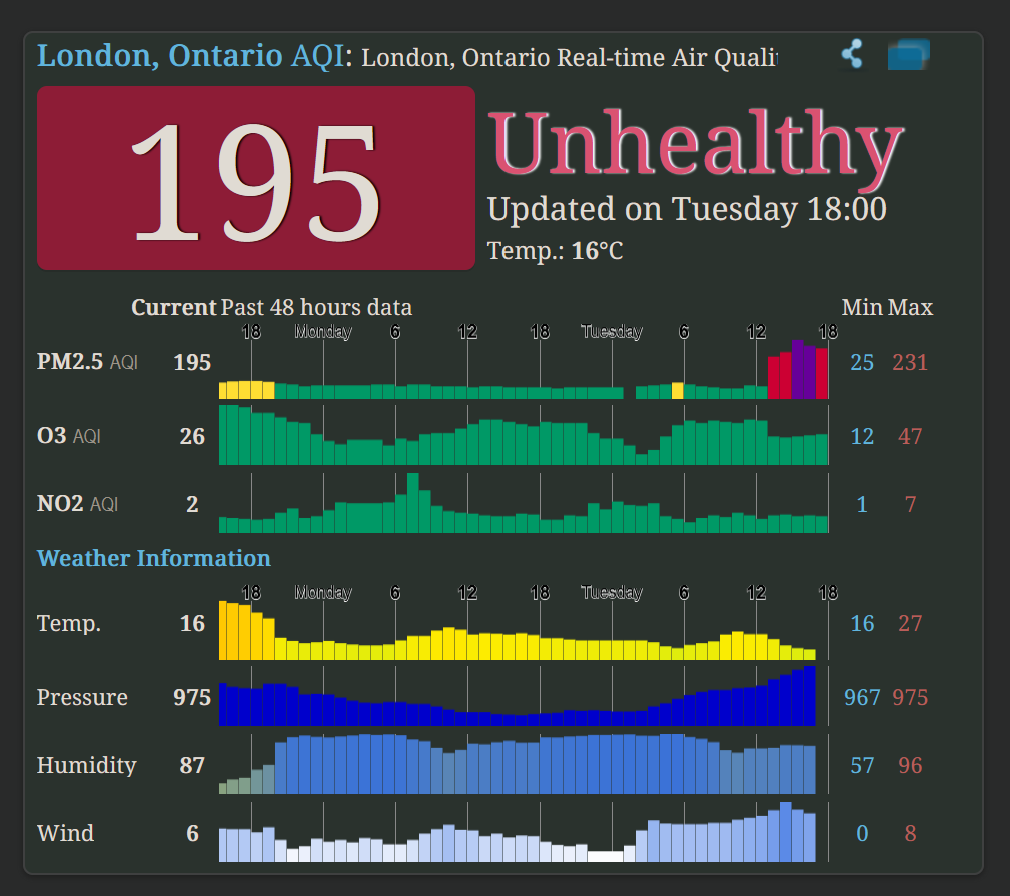
The AQI chart is slightly different in how it illustrates the threat, but the general thought is the same. The higher the value, the worse the air quality will be. In the case of London, Ontario’s current air quality, it falls into the unhealthy category, which stresses avoidance if at all possible; especially for at risk groups.
An important point to note: these charts give real time updates on the air quality at specific points. In terms of forecasting, wildfire smoke forecasting isn’t perfect. Sometimes air quality ends up better than expected; other times, it can be much worse. Use forecasts as guidelines (not absolute truths) and if you want to know the real time statuses, check the “observed conditions” on the AQHI site & verify the updated time on the AQI site.
Relief looks to take place after Thursday for the affected areas, as the low pressure finally moves out of the region and a synoptic pattern shift ends the northerly flow bringing the smoke to the area.
Until then, we’ll have to deal with it because, unfortunately, this may be a common occurrence throughout the summer. Peak wildfire season is just beginning.


