


The 2024 Yearly Weather Recap For Hamilton, Ontario
An overview of 2024's observations vs expected climatology + year end photos

Year three of this side project tracking weather at YHM (Hamilton Airport) will begin in 2025. It originally began as an excuse to better learn Python and build charts & graphs I was interested in that I couldn’t find elsewhere. On the forecasting side, I found I’d omit too many details when making them on Twitter, so writing out longer forecasts and case studies here, with the side project to give me that push, worked well in tandem. I look forward to analyzing the data, and people reading seem to be enjoying it (as least in the feedback I receive). I still continue to look for new ways to add to it as I go.
Anyway, to get to the reason you’re here, let’s look at how 2024 went.
Climatology: Yearly Breakdown
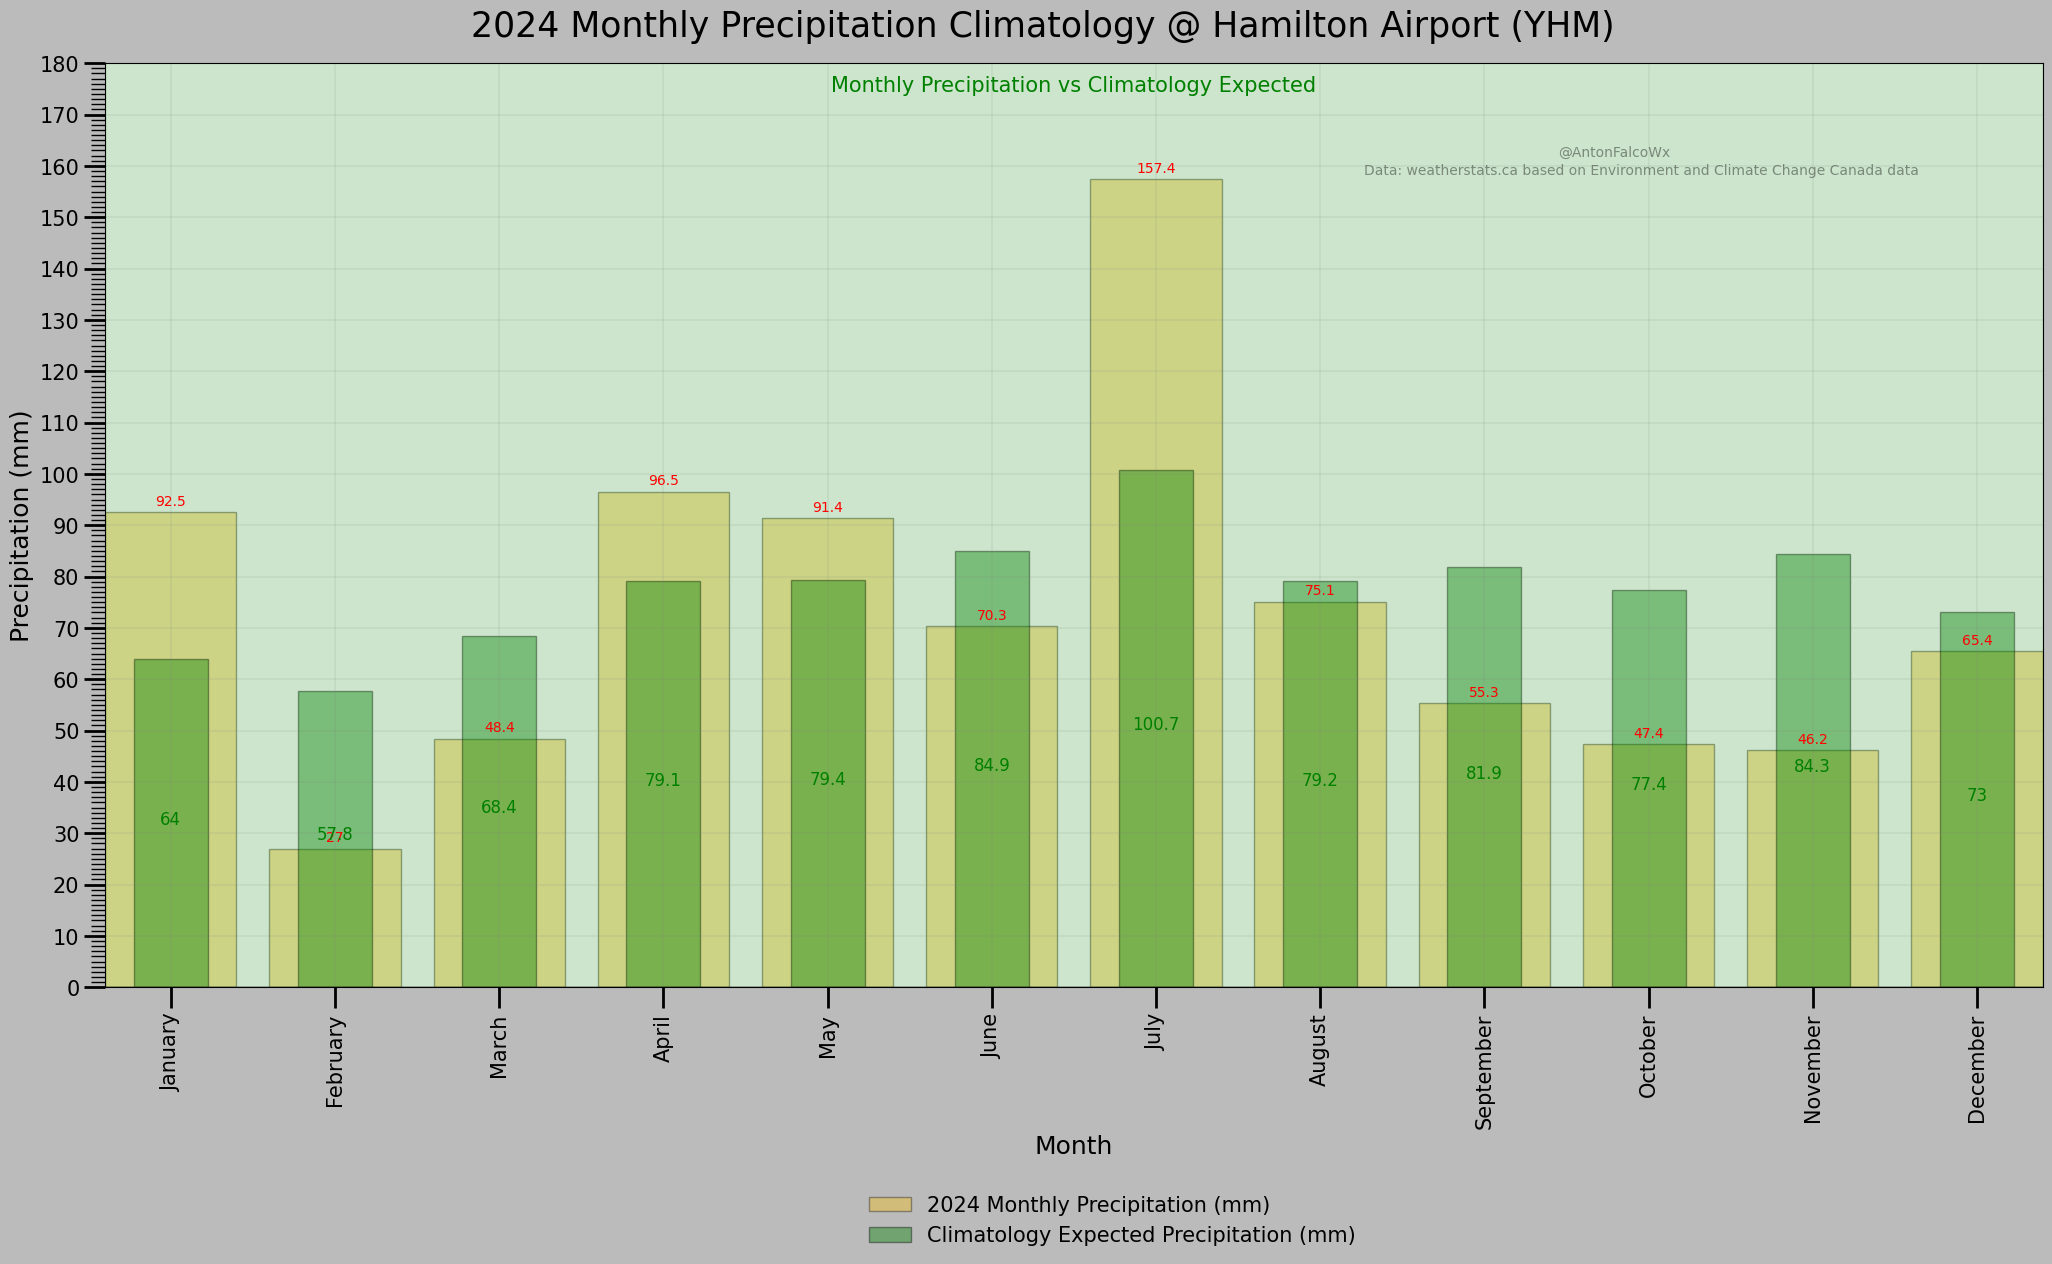
For 2024, I used the 1981-2010 YHM climate normals visualization. In short, these are the monthly average temperatures and precipitation totals you can expect to see per month at the Hamilton airport station. I started the year with the 1981 dataset and wanted to finish it out for the year, but I will be switching this to the 1991-2020 normals for 2025.

The graph above may look overwhelming at quick glance, but don’t worry. I’ll break it down for you. I’ll also split temperatures and precipitation into their own graphs below.
The light green bar is showing you the total precipitation that fell at YHM per month. The thinner, darker bar is showing you what was expected to fall based on climatology.
The dotted red line is the monthly average high temperature recorded per month in 2024. The solid red line is the climatology expected high temperature per month.
The dotted blue line is the monthly average low temperature recorded per month in 2024. The solid blue line is the climatology expected low temperature per month.
High Temperatures
Here’s how the high temperatures broke down in 2024:
Mean Yearly High Climatology Temperature = 12.67°C
Mean Yearly High Temperature = 14.8°C
Yearly Departure From Normal = 2.1°C
Starting with the high temperatures, you can see that every month in 2024 exceeded the expected climatology monthly temperature, but many months, especially in summer, came quite close to climatology (within a degree or so).
Broken down further, the summer months had the smallest discrepancy between observed and expected (less than one degree difference from June through August), but much of the start of winter 2024 was very warm. February’s average highs, for example, were 5.11°C above average for the month. March was 3.94°C above average. Much warmer than expected.
In terms of closest to climatology, August was the winner, recording only a 0.19°C difference to climatology. As stated prior, no months, in terms of the high, dropped below climatology.
The three hottest months of the year (unsurprisingly):
June: 24.9°C average
July: 26.9°C average
August: 25.5°C average
In summary, the colder months were milder than expected, while the summer months were nearly exactly as expected in terms of climatology.
Low Temperatures
Here’s how the low temperatures broke down in 2024:
Mean Yearly Low Climatology Temperature = 3.12°C
Mean Yearly Low Temperature = 5.1°C
Yearly Departure From Normal = 2.0°C
In terms of the low temperatures, it followed a pattern mirrored the highs: the months highest above average occurred earlier in the year. January, February and March saw low temperatures for the month exceed climatology by 2.59°C, 4.1°C & 3.64°C respectively. The summer months stayed close to climatology. June exceeded expected by 1.1°C, July exceeded by 0.58°C; lower than the winter months.
In terms of closest to climatology, August was, once again, the winner, recording a -0.23°C difference to climatology. It was the only average temperature reading for the year, both in highs and lows, to drop below climatology.
The three coldest months of the year (also unsurprisingly):
January: -6.7°C average
February: -4.5°C average
December: -4.5°C average
In summary, by climatology, the colder months were a lot milder than expected, while the summer months were nearly exactly as expected.
When the highs and lows are separated, it becomes even more clear in the graph below.

Precipitation
The following is a list of yearly precipitation totals that YHM expects to see on a yearly basis vs what was actually received in 2024:
Total Expected Yearly Rainfall: 791.9 mm
2024: 819.1 mm — exceeds average by 27.2 mmTotal Expected Yearly Snowfall: 156.5 cm
2024: 52.7 cm — below average by 103.65 cm.Total Expected Precipitation: 930.1 mm
2024: 872.9 mm — below average by 57.2 mm
The yearly precipitation average for 2024 ended up being below average (72.7 mm/month received vs 77.5 mm expected). This should come as no surprise when you consider that only four of the twelve months exceeded climatology. August through December all recorded below average precipitation totals. The remaining eight fell considerably below climatology; in some cases, only reaching ~50% of expected! Looking at you, February and November.
To elaborate, February, specifically, only dropped 27 mm of precipitation. It is expected to see 57.8 mm. As a case study, not only was it a very mild month (multiple daily records: highs and lows were broken), it was very dry, too. If not for the 19.3 mm of rain received on the 27th & 28th, the month would have been barren.
In contrast, the four months that exceeded climatology were January, April, May and especially July. Why was July so intense? July 10th & 11th featured the deluge of rain from Hurricane Beryl’s remnants and accounted for 54.5 mm of the total in just two days, with 37.6 mm falling on the 10th and establishing a new daily record. Not to be outdone, a large, slow moving synoptic system from the US Central Plains proceeded to drop 49.8 mm of rain on July 16th, which broke that daily record as well.
The three snowiest months of the year, despite falling well below climatology expectations were December, January & March, respectively. December saw 14.5 cm fall at YHM, while January saw 9.4 cm and March saw 8 cm. January should see 40.8 cm of snow, December should see 33.5 cm and March should see 26.5 cm. Obviously, none of those months came close to expectations. Large amounts of snow were hard to come by in 2024 at YHM. You would have to visit nearby Buffalo.
Overall, the higher than average precipitation months weren’t enough to counter the more numerous lower months, so 2024 ended lower than expected for monthly and yearly precipitation totals. The distribution was far from even, though, as you’ll see below.
Interesting side note: Pearson Airport station in Toronto, only 80 km away, destroyed both its July monthly and yearly precipitation records this year. Southern Ontario had many events that brought widespread flooding, but Hamilton was largely able to dodge the worst of it.
By the Days - In 2024
The following observations were the highest of highs, lowest of lows, and noteworthy measures and dates recorded throughout the year at YHM.
*Note that precipitation is treated as a different, distinct category than rainfall*

Highest High Temperature = 33.4°C on 06-18
For the second consecutive year, the highest daily temperature recorded for the year falls in June.Lowest High Temperature = -9.7°C on 12-22
A last minute entry into the coldest daytime high of the year, as it just happened over a week ago.Highest Low Temperature = 21.5°C on 08-02
August continued July’s hot end-of-month and saw at least six low temperatures exceeding 18°C.Lowest Low Temperature = -20.9°C on 12-22
A strong arctic air mass came through YHM on the 22nd, affecting both the high and low temperature for the YEAR in one shot. January or February usually take this, but neither month got below -17°C.Highest Dew Point = 25.9°C on 08-01
A very muggy air mass was in place to start August. This high dew point ties into both the highest low temperature and the humidex below.Highest Humidex = 43.0°C on 08-01
Anecdotally, I remember being outside a good portion of this day, unfortunately.Highest Recorded Wind Gust = 103 km/h on 12-30
A strong southwesterly low level jet was in place over YHM in the early morning hours of the 30th and stronger winds that mixed down resulted in this gust.Lowest Windchill = -28.0°C on 12-22
Highest Precipitation Day = 49.8 mm on 07-16
Surprisingly, this was not from the remnants of Beryl, which dropped 54.5 mm of rain over the 10th & 11th combined. It was from a large, slow moving synoptic system from the US Central Plains that proceeded to drop 49.8 mm in 24 hours.Highest Snowfall Day = 6.8 cm on 01-23
Certainly not a banner year for snowfall.Yearly Average Health Index = 2.41
Highest Health Index = 7.00 on 05-18
Fortunately, unlike 2023, YHM wasn’t subjected to repeated events of wildfire smoke from BC/Alberta or Quebec, so, overall, air quality was improved in 2024.
Great Lakes Ice

It was a year to forget if you’re a fan of Great Lakes ice. Or skating. Or ice fishing. Other than a brief few days at the end of November, at no point throughout the rest of the season did the cumulative amount of surface ice exceed climatology. It marked the second consecutive year of below average lake ice totals; especially during the expected peak of early to mid February.
The second chart below shows the individual lake ice breakdowns, with only Lake Michigan coming close to climatology mid January.

This concludes my 2024 YHM weather analysis. It was a warmer than average year overall (especially in the winter months), but a drier than average year in terms of overall precipitation (and especially by snowfall standards, which was far below expectations).
I will leave you with some non-weather pictures that I managed to get throughout the year. Unable to go to the US for tornadoes in 2024, and a lack of photogenic storms here in Ontario, meant a severe lack of weather photos. Luckily, it was a great year for geomagnetic storms (May 10th & October 10th) and wildlife.
Thanks for reading. If you’s like to see more of my photos, visit antonfalco.com


